Nowadays, many traders actively trade in different markets - stocks, cryptocurrencies, futures, and others. Usually, you need to use different platforms to work with traditional instruments and digital currencies. This is not very convenient. TigerTrade solves this problem by allowing you to trade cryptocurrencies, fiat currencies, securities, and derivatives in one terminal.
General information
The main advantage of the terminal comes down to the ability to trade on different exchanges and markets - more than 20 options are available. The platform was launched in 2015 and immediately became popular among professional traders. Now the terminal is used by more than 15 thousand clients all over the world.
Tiger. Trade allows you not only to trade in different markets but also to receive the necessary data for high-quality analytics.
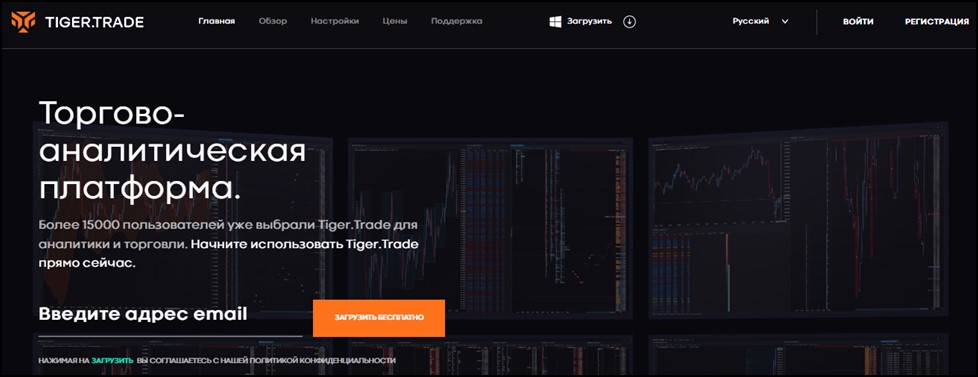
To install the terminal on your device, just open the main page of the TigerTrade website, enter your email and click on the download button. All functions can be fully used only after registration. The user has the opportunity to choose a suitable service package.

You do not have to pay for a license to trade cryptocurrencies. However, other markets are only available after paying for the membership.
The advantage of a free license is that it opens up quick and legal access to trading on various cryptocurrency exchanges through the TigerTrade interface. This means you do not have to access each platform individually. This is very convenient and saves a lot of time.

It is important to note that in the case of the Binance exchange, only the accounts that have not been registered through the referral link will get free access to the crypto market. If an affiliate link was used for registration, then you need to open another account on the exchange - especially for working with TigerTrade.
If you choose to use the terminal for a fee, you will get access to 10 exchanges. It is possible to test trading stocks/futures for 14 days and only then make a decision on payment.
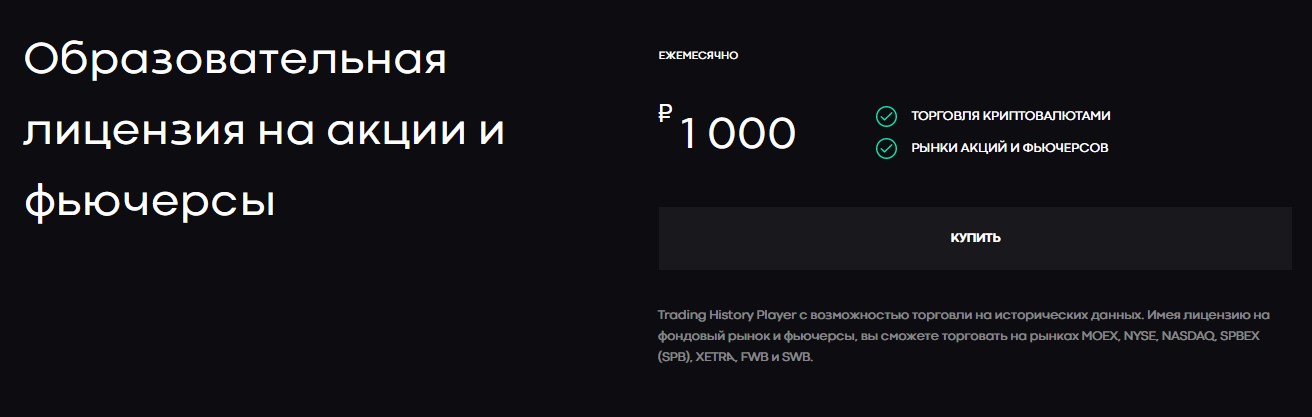
There is also an educational license that allows you to trade on historical data. It is a good tool for traders looking to test their strategies.
How to start trading
After successful registration, you need to enter the platform system using the "Login" button. A screen will open in front of the user, on which there is almost nothing except the top, bottom, and side menus.

To get access to the tools of the crypto market, you need to do the following:
- move the mouse over the top tab "File";
- select the "Connect" item;
- click on the "Configure" button.
As a result, a window will open for setting up the connection.

After you click on the blue plus, the names of several cryptocurrency exchanges will be displayed. When you click on the appropriate option, a window will appear with a suggestion to open the instructions to set up a connection. You can click on "No".

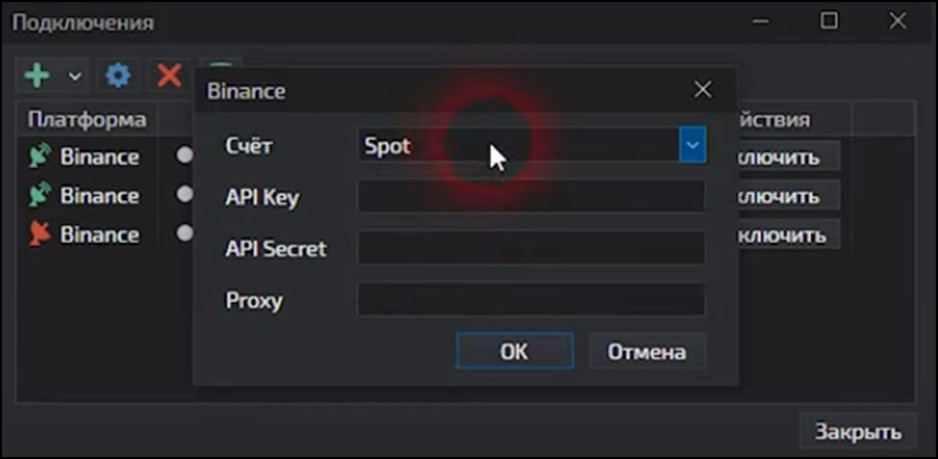
Next, a window will open in which you will need to select the type of account. For example, spot trading, margin, or futures.
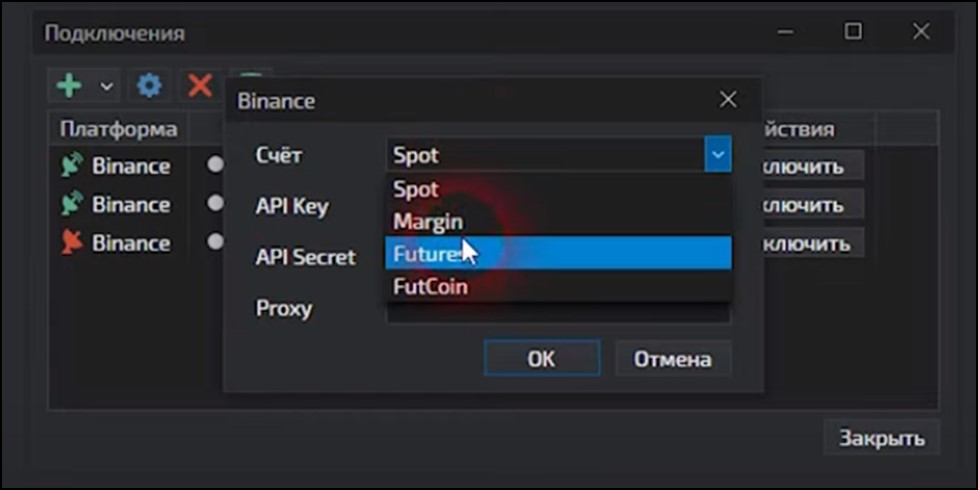
Here you can connect several options at once. To do this, after selecting each of them, you need to fill in the data in the fields of the window and click on "OK":
- Select “Spot”, fill in the empty fields, click “Confirm”.
- Select “Future”, enter data, click on the "OK" button again.
You need to enter the API key and API secret of the account on the selected cryptocurrency exchange. The key is the user's IP, the secret is the password.
This functionality is convenient because the user can simultaneously connect several types of accounts, making his trading more flexible.
After connecting the API keys, you need to go to the Open section at the top and select the appropriate option for the information you want to view:
- Graph.
- DOM.
- Quotes.
- Transactions feed.
- Statistics.
- Volume search.
- All prices.
- Options board.

When you select "Chart", the shell with the functions is loaded, but the asset price line is not immediately displayed. To display it, you must click on the folder icon in the upper left corner. When you hover over it, "Select tool" appears.

After clicking on this icon, a search box will appear in which you must enter the ticker of the desired cryptocurrency.

The system then displays all available currency pairs with the selected coin. The trader has to click on the option he wants to use. After these steps are completed, the chart is loaded.
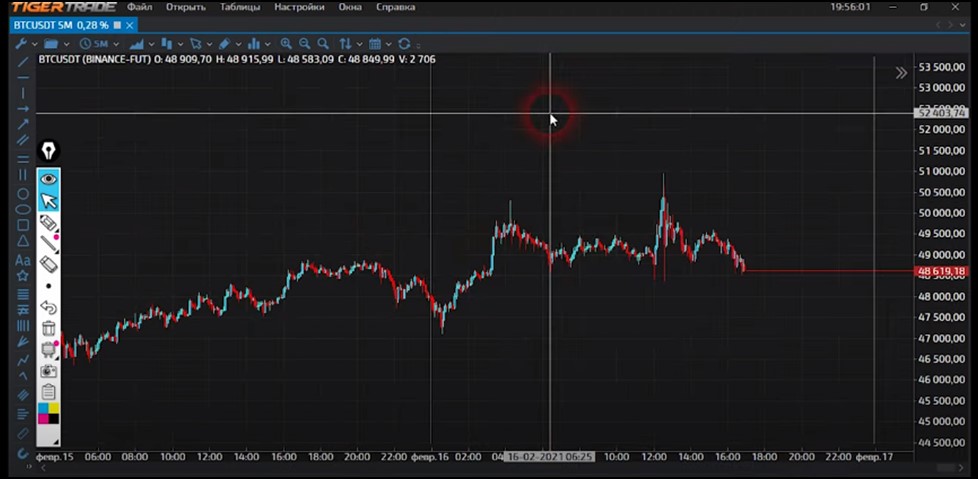
To change the account type (spot/futures), you must remove or add a hyphen in the currency pair name. If you remove the hyphen between the names of two coins in the upper left corner, the futures market will be loaded, if you add the hyphen, the spot market will be displayed.

For a more detailed analysis of the various cryptocurrencies, you can turn on Depth of Market. This is done via the "Open" tab. If you click on the word "DOM", the list of price values will be loaded into the terminal. As with the chart, you can enter a suitable cryptocurrency pair on the left side of the Depth of Market interface. After you select the desired pair, Depth of Market will start loading.

If desired, the Depth of Market tab can be dragged to the left side of the chart. This will allow you to simultaneously see all data groups without switching between the chart and order book tabs.
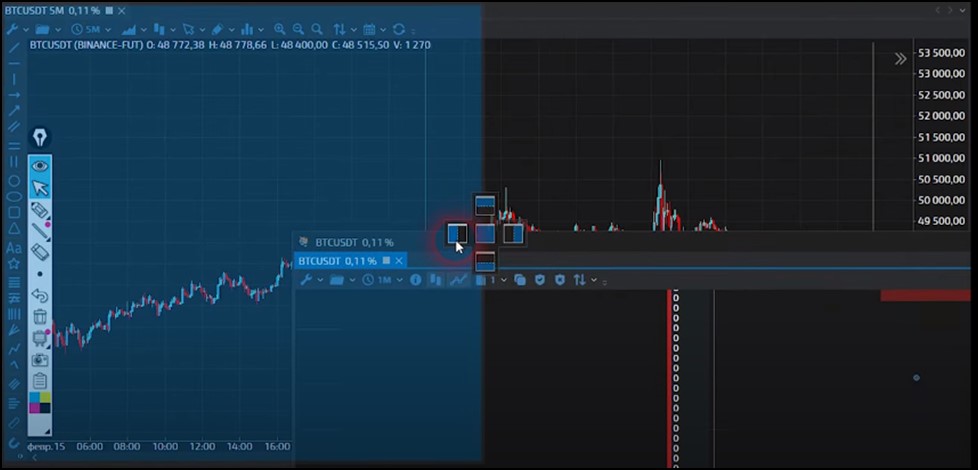
Several order books can be easily added to the left side of the chart - one for each selected crypto pair.
The TigerTrade terminal is designed in such a way that a trader can quickly change the working environment and simultaneously open deals on different types of accounts.
Functions of the TigerTrade platform
The terminal allows the use of a large number of instruments for the efficient trading of crypto assets. Some of them perform similar functions but differ in the way they display information in the terminal window. This diversity allows the trader to choose the most convenient form of displaying the required data.
Price Movement Charts
This is a basic way to keep track of price movements. There are 5 types of charts in TigerTrade. The most common are 2 options:
- Standard candlestick. Candles have a comfortable color.
- Footprint. This chart displays data on closed buy or sell trades.
The second option is mainly used by experienced traders. The terminal has 20 options for displaying a footprint.

Also in TigerTrade, there are more than 50 different indicators and 20 graphical tools for drawing figures and levels.
All these tools allow a trader to customize the process of performing technical analysis.
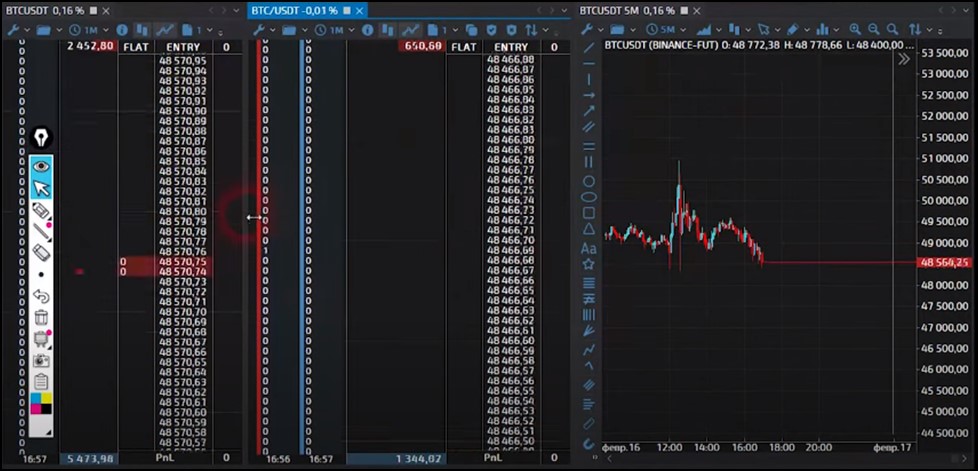
DOM
TigerTrade’s DOM is a dynamic display of prices. A trader can track the dynamics of changes in the value of an asset.

The Depth of Market includes 3 additional sections, each of which performs its own function:
- Section 1. Information about open deals is displayed here. In this part of the terminal, you can also see a list of recently closed positions and the financial result for one trading day.
- Section 2. The footprint graph is displayed here, which can be customized.
- Section 3. Logs are displayed here. If necessary, a general histogram of volumes and a unique indicator showing the balance are added here.
By launching the Depth of Market, a trader receives a convenient information panel with data dividing into groups. This allows you to quickly find the information you need and conduct a more accurate analysis of the market situation.
Statistics
At the bottom of the terminal, you can display data on completed transactions. They are in the form of a list.
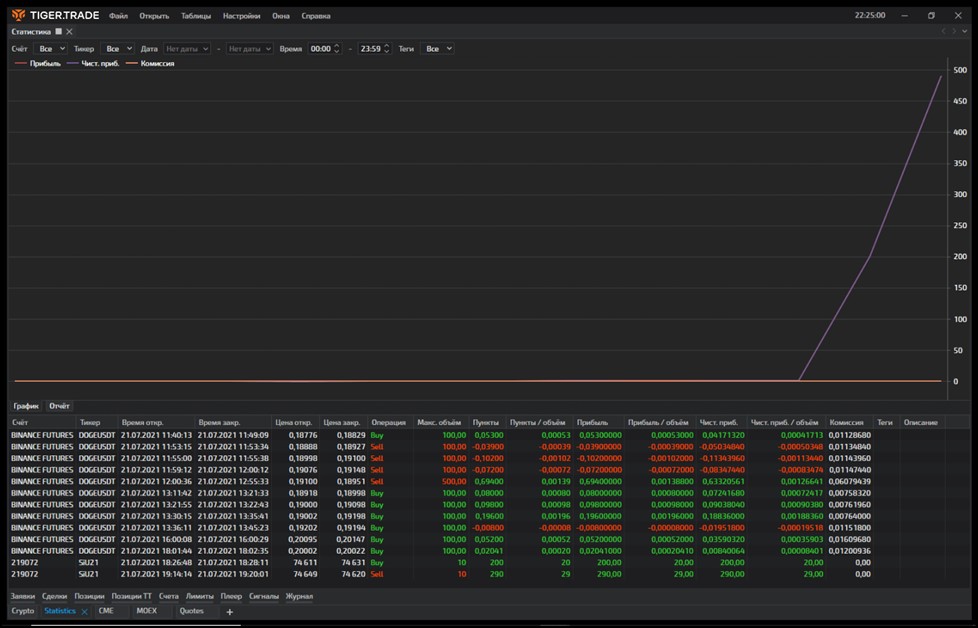
This tool has several advantages over the standard exchange functionality:
- position filtering by custom parameters;
- the ability to export information from the list to an Excel table;
- accounting of all transactions;
- the ability to build a graph of profitability.
Using this section of the terminal, an investor can get detailed information on each closed position:
- time of entering and exiting the market;
- size of the commission;
- position volume;
- amount of profit or loss;
- the direction of the transaction.
In the upper part of the window there are 3 buttons that allow you to switch between different charts:
- Profitability in points.
- Profitability in rubles.
- Commission.
A trader can set filters:
- account using which the position was opened;
- type of tool;
- date;
- time of execution of the transaction.
All data is displayed in real-time. This functionality allows the player to accurately determine the effectiveness of his trading with different assets in certain periods.
Previously, traders had to keep a log of transactions to generate statistics for their trade. Such information is needed to identify the most effective trading times and those instruments that provide the best results.
Now all this data is displayed in a convenient and understandable form in the TigerTrade terminal. Investors do not have to compile the statistics themselves - the platform does that instead. All that remains is to analyze the data and adjust the trading strategy correctly.
Trades log
Here you can find information about all executed trades for a particular instrument for a selected period of time.

The data is displayed on the screen in the form of a table with the following sections:
- the direction of the transaction;
- time of completion;
- volume;
- price.
If desired, information on the change in open interest (the number of open contracts) can be added to the table.
There are other additional functions in the log:
- filtering and aggregation of positions. These options are needed for high-quality structuring of fresh information.
- alerts are special signals. With this function, a trader can assign a convenient sound or color for transactions with a volume exceeding a specified level. Due to this selection, such lines will be easily visible in the general table.
Both the statistics and the feed allow you to break down the full range of market data into convenient groups. The investor will see at what time the trades of what type were executed. And in general, he will be able to quickly find all the necessary information about past transactions in the table.
Analytics
For more detailed analytics, the terminal has two additional modules:
- volume search;
- all prices.
The functionality of the first module allows searching for values corresponding to a large volume. The periods found are displayed in the chart and allow a quick analysis of the market situation.
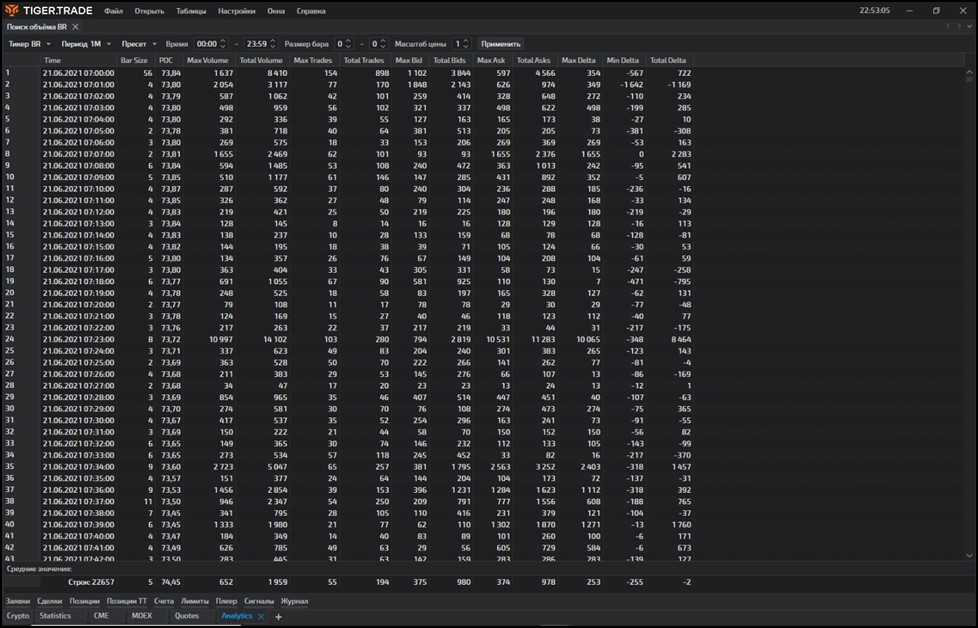
With the help of a table of all prices, a trader can see how much volume was at each price level of an individual asset within the required period of time. That is, the most detailed data on the volume is displayed here. All this information allows you to see when the asset was in maximum demand and at what periods the players lost interest in it.
Quotes
The main benefit of the quotes window is that the trader can see the key parameters of the traded assets in real-time.
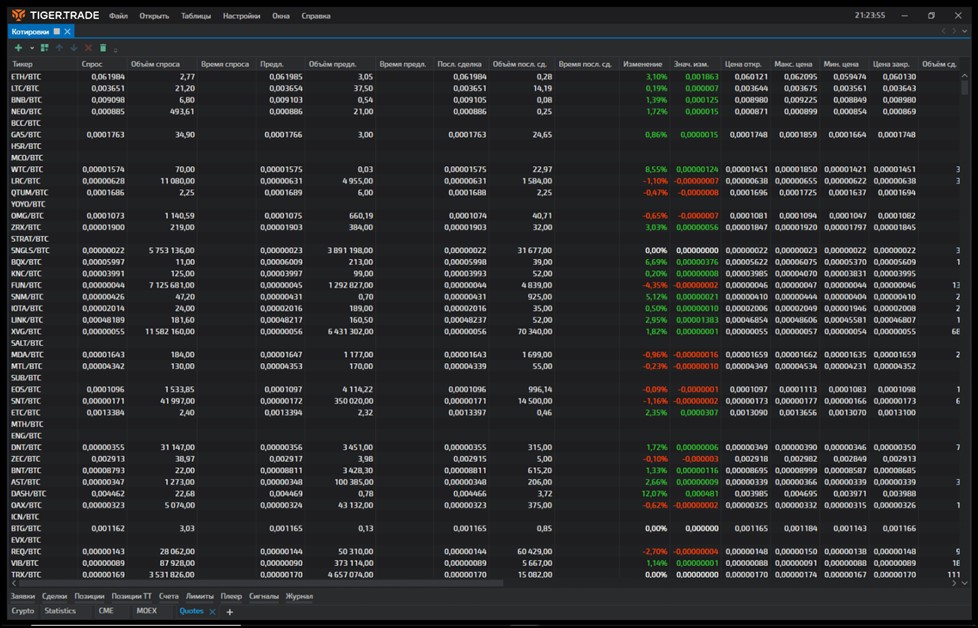
Here it is possible to track the following data:
- change in the value of an asset since the opening of a deal (displayed as a percentage);
- open interest;
- the price of the last open position.
The details in all these groups can be changed with a single click. It is enough to click on another tool and information on it will be loaded in all sections of the table. This functionality allows you to view key information on a large number of crypto assets in a short period of time.
Player
This function allows you to carry out a high-quality check of a trading strategy using the history of quotes of an individual instrument. Here you can play data in real-time by rewinding and speeding up the process. That is, strategies can be evaluated accurately and quickly. For convenient switching between player functions, the terminal has hotkeys.

Risk Manager
This is a built-in feature that can hardly be overestimated. After all, one of the main reasons for losing money in trading is inadequate risk management.
Cryptocurrency is a volatile instrument and when trading it, you can lose money very quickly. To prevent this, you first need to limit the risks by setting a loss limit. Thanks to the risk management feature, limiting losses becomes a simple task.
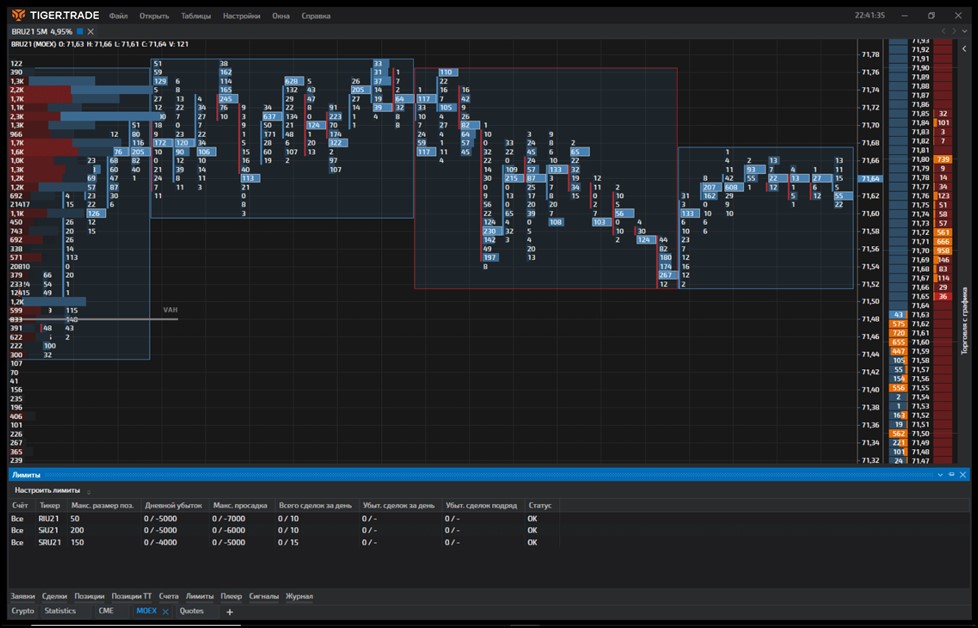
The trader sets the number of acceptable losses per day or week. When this limit is reached, the risk manager automatically blocks the trade. As a result, the user can follow the market but temporarily loses the ability to open trades. In order not to reverse the decision due to emotions, you can activate the password option. In this case, you will not be able to change the settings after the lock.
TigerTrade mobile application
This is not a standard terminal adapted for iOS and Android, but a program that allows you to make money by copying transactions of successful traders.
TigerTrade developers promise profitable crypto trading on autopilot (almost passive income). In this case, the trader must confirm the copying of each transaction by pressing one button. That is, an order can be opened only with his consent. All transactions are verified on the first level blockchain Binance Smart Chain.
The application is still under development. But you can leave a download request and get the program from TigerTrade to be one of the first users. To do this, you need to visit the website https://copy.tiger.trade/ and enter your email in the appropriate line.

Telegram: https://t.me/deeptrd
My trade: https://app.aivia.io/ranking/136?A=VA9GZqD97a