Let's say, you have an idea for a trading strategy. You are trying to realize it in some way, by hiring a programmer or by any other means available to you.
But it is very important to understand whether your strategy is viable. Will it result in profit, or not?
Here is how to do it.
More precisely, I will describe how I do it, in the course of this and 2 more future articles.
Having extensive experience in creating a trading algorithm, I understand more or less in advance its strengths and weaknesses ...
There are simple algorithms, usually the most effective ones, and there are more complicated ones, they have their advantages, but we will talk about this later.
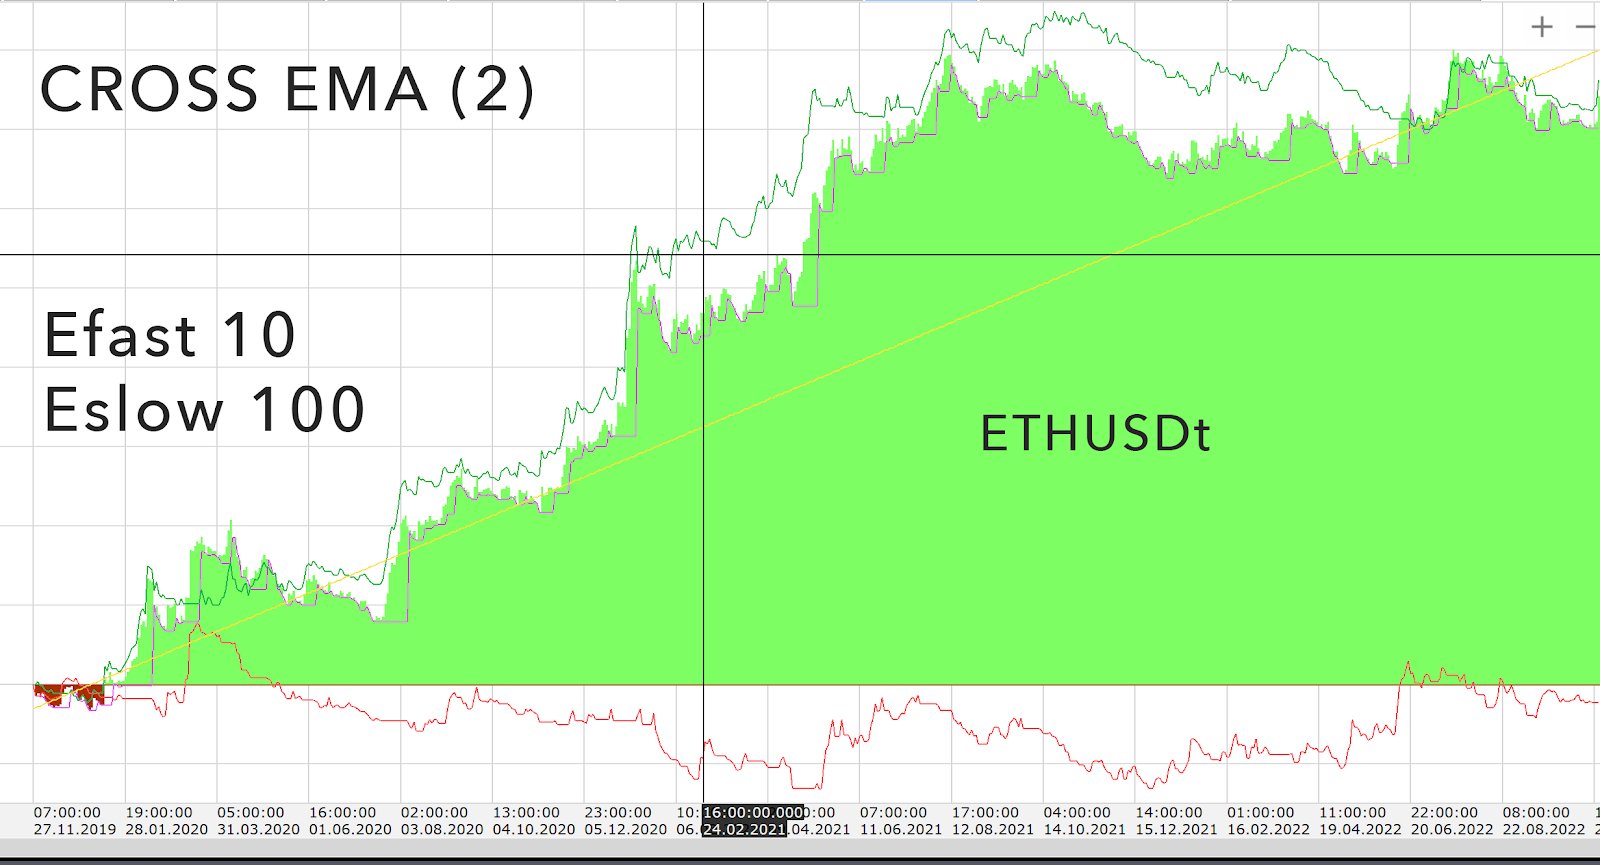
I will show an example of the simplest strategy: " Double Crossing of EMA"
2 moving averages are applied on the chart, Fast EMA, and SlowEMA.
If the fast EMA crosses the short EMA on the bottom, then this is a buy signal, if the fast one crosses the slow one on the top, this is a sell signal.
This is a reverse trend strategy, that is, a buy signal is always a signal to close the current short trade. And vice versa. I hope it's not very confusing.
This strategy has 2 optimization parameters:
EMA fast (Efast)
EMA is slow (Eslow)
Different settings will yield different results, for example:
Setting Efast at 10 and Eslow at 100 when testing will show the following profitability on the ETHUSDT trading pair for 3 years:
Setting Efast at 20 and Eslow at 150 will yield different profitability on the ETHUSDT trading pair for 3 years:
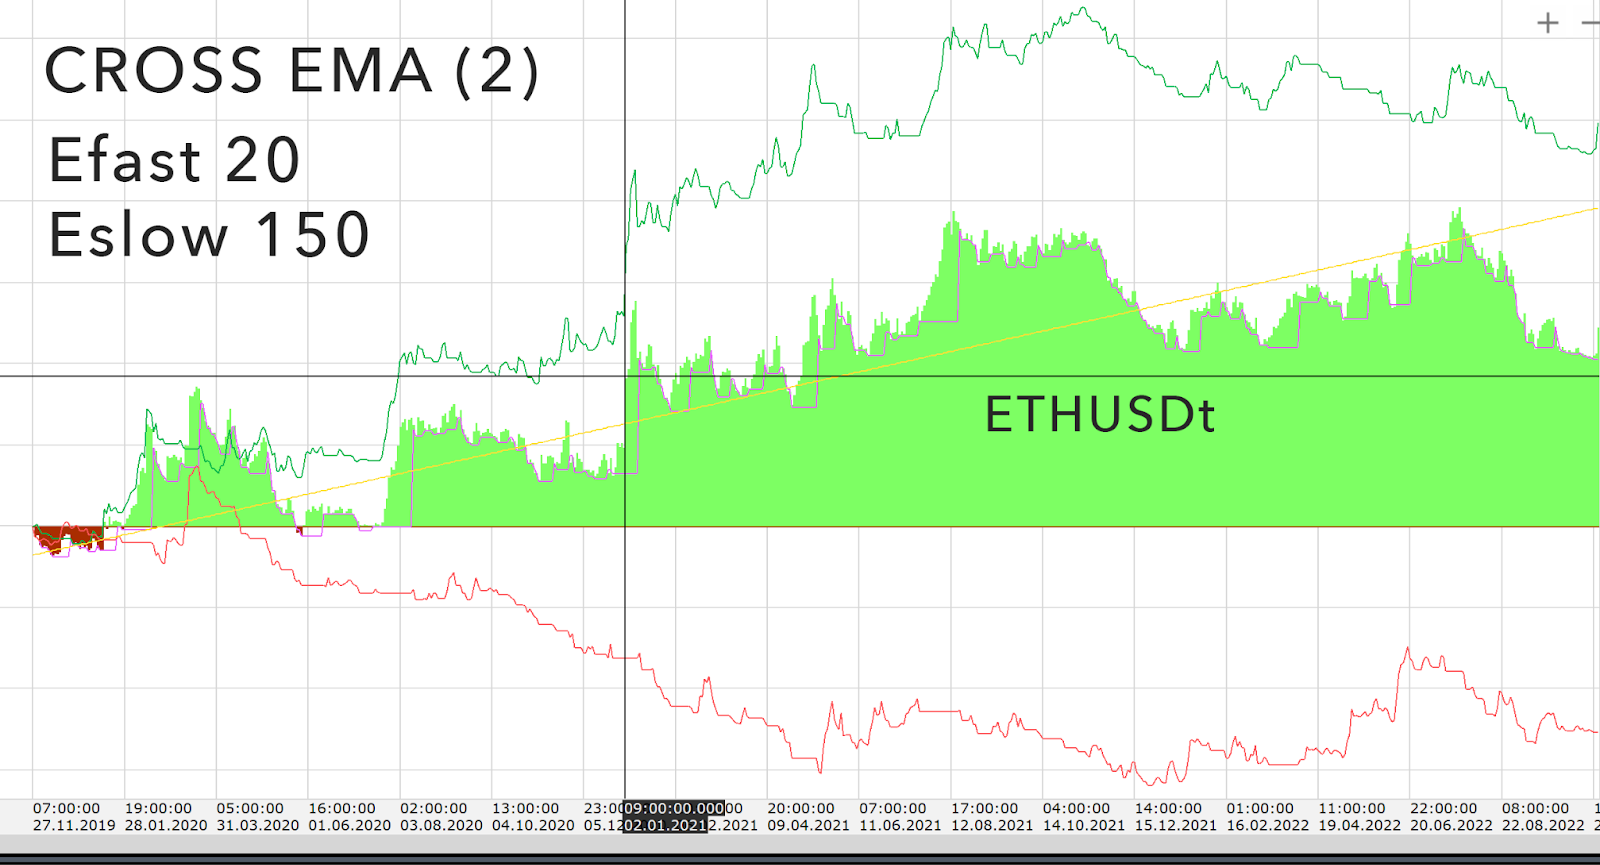
It is important for us to determine which settings will give the best profitability in the history of 3 years, unfortunately, there is no more history available in the cryptocurrency market regarding BINANCE FUTURES.
Of course, it is also important to take into account the factors of maximum drawdown, and in order for profitability to be as consistent as possible. Here is a good example:
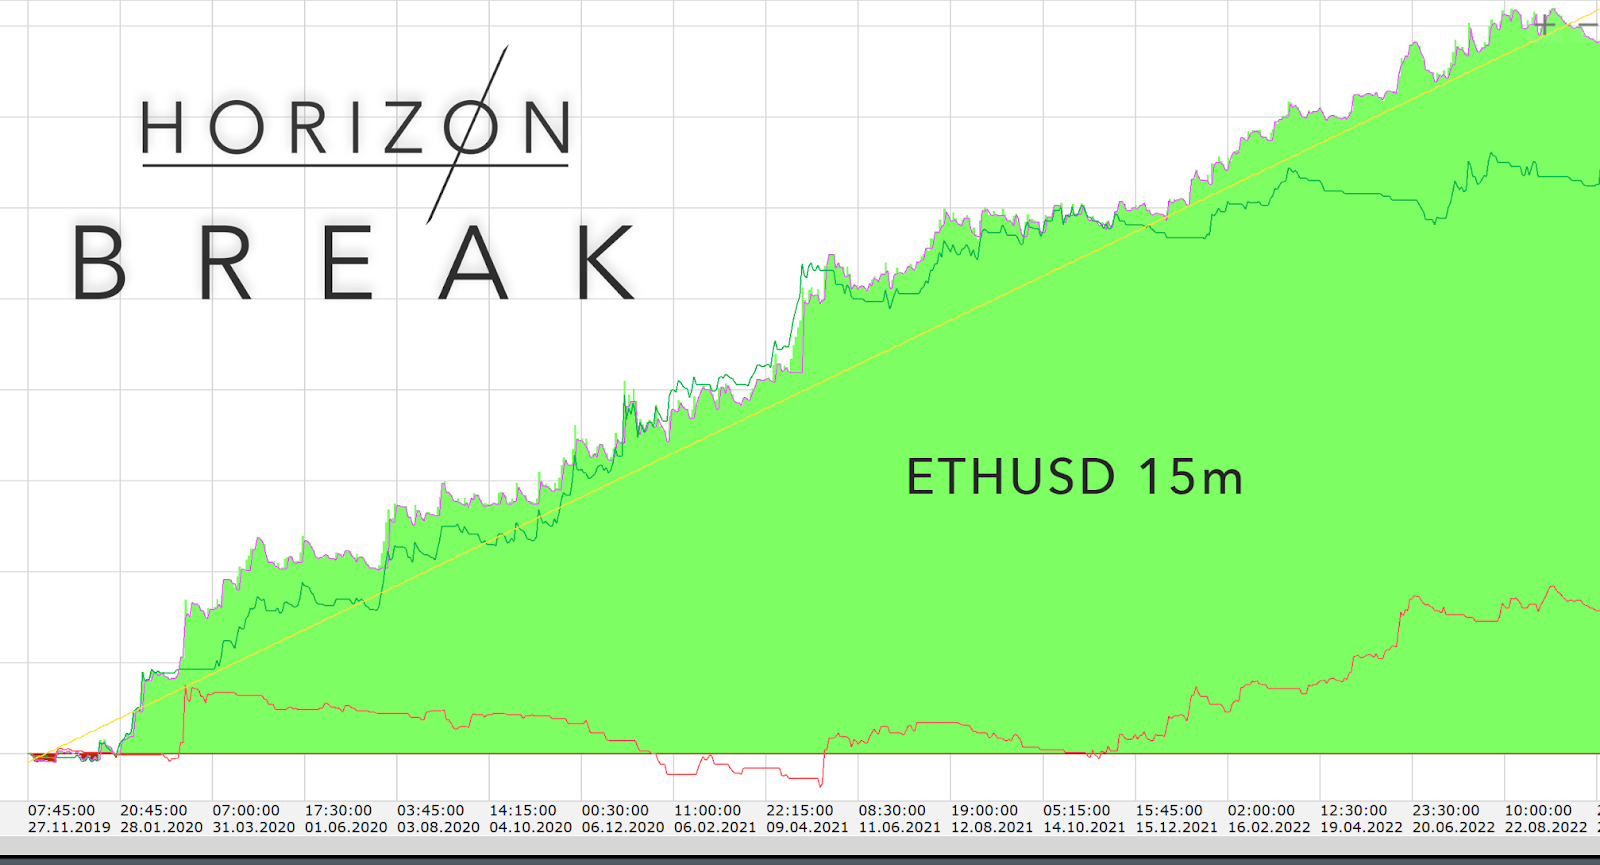
This is a test of the HORIZON BREAK strategy on the ETHUSDT trading pair for 3 years.
Let’s say, you found those optimal parameters, you see the profitability, and you think that by executing this strategy there is an opportunity for a hefty profit. But is not that simple.
Many traders are not taking into consideration the OBSERVATIONAL ERROR factor.
It is a condition when the settings of the strategy perform well in the backtesting environment. But at the same time, in live trading, your entire deposit will almost certainly be liquidated.
Why is this happening? It looks great in the backtesting, but why is the strategy failing in the LIVE trading?
This happens because market conditions are constantly changing in one way or another. And these changes are much more complex than just “Flat” or “Trend”
You may not notice it, but the performance of your strategy and the amount of the deposit will be the indicator of severe pain, as a part of the systematic trading.
So. There is a problem, indeed. It has to be solved somehow.
You must optimize your trading strategy, and your algorithm, to be profitable in real-time LIVE trading.
How to do it?
In fact, there are several methods for backtesting and optimizing trading strategies, which I will describe in the next article because I don't want to bore you out.
I use these methodologies when optimizing, selecting, and analyzing my trading strategies. Therefore, I am the real source of this information and will unveil it in the next posts.
For all questions, message me on TELEGRAM:
https://t.me/Jeck_SAVINSKYI
Real-time performance and statistics: https://tradelink.pro/portfolio/df18b46a-ff64-4d01-84e8-31027975e96d?step=day
Jeck Savinskyi